The New Mexico Environmental Department (NMED) has been sampling water quality within the Rio Chama for several years. Although there is a combination of 33 sample stations where several parameters are monitored, there is not a sufficient amount of data. Below is a map of the sites within the Lower Rio Chama Watershed. The 5 below Abiquiu Dam near the project reach include studied within this course are; 22, 23, 24, 33 and not labeled on the map, below 33.
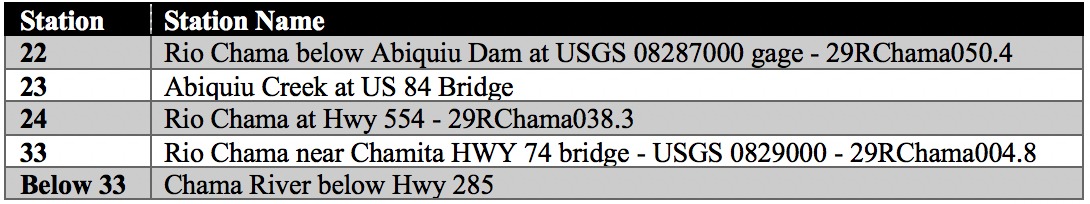
Figure 1: Stations where data has been collected along the Chama River Below Abiquiu Dam
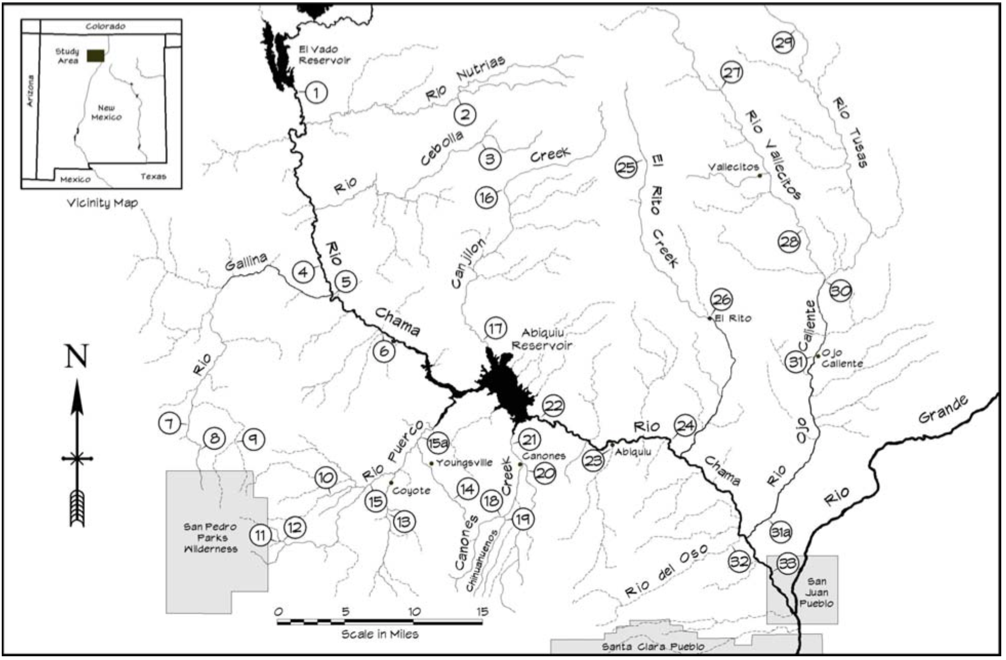
Figure 2: A map provided by the NM Environmental Department of sampling locations in the Lower Rio Chama Watershed
This map is from: Surface Water Quality Bureau, & NM Environmental Department, (1999)
With the data provided through NMED, graphs of pH from 1999 to 2017, Dissolved Oxygen from 1999 to 2017, Turbidity from 1999 to 2017, Temperature of the water from 1999 to 2017, Bacteria in the form of Fecal Coliforms in 1999, Phosphorous from 1999 to 2007 and Nitrogen from 1999 to 2007 are produced. On each of the charts there are green lines stating the lower and upper limits of the standards. Although there are error bars in place, there are certain areas of the river that have higher standards for each, such as temperature and fecal bacteria. For more detail on where the river exceeded refer to the NMED information links at the bottom of the page. In the future to present more fuller data, more monitoring will need to be produced as well as more recent impairment evaluation.
With the data provided through NMED, graphs of pH from 1999 to 2017, Dissolved Oxygen from 1999 to 2017, Turbidity from 1999 to 2017, Temperature of the water from 1999 to 2017, Bacteria in the form of Fecal Coliforms in 1999, Phosphorous from 1999 to 2007 and Nitrogen from 1999 to 2007 are produced. On each of the charts there are green lines stating the lower and upper limits of the standards. Although there are error bars in place, there are certain areas of the river that have higher standards for each, such as temperature and fecal bacteria. For more detail on where the river exceeded refer to the NMED information links at the bottom of the page. In the future to present more fuller data, more monitoring will need to be produced as well as more recent impairment evaluation.
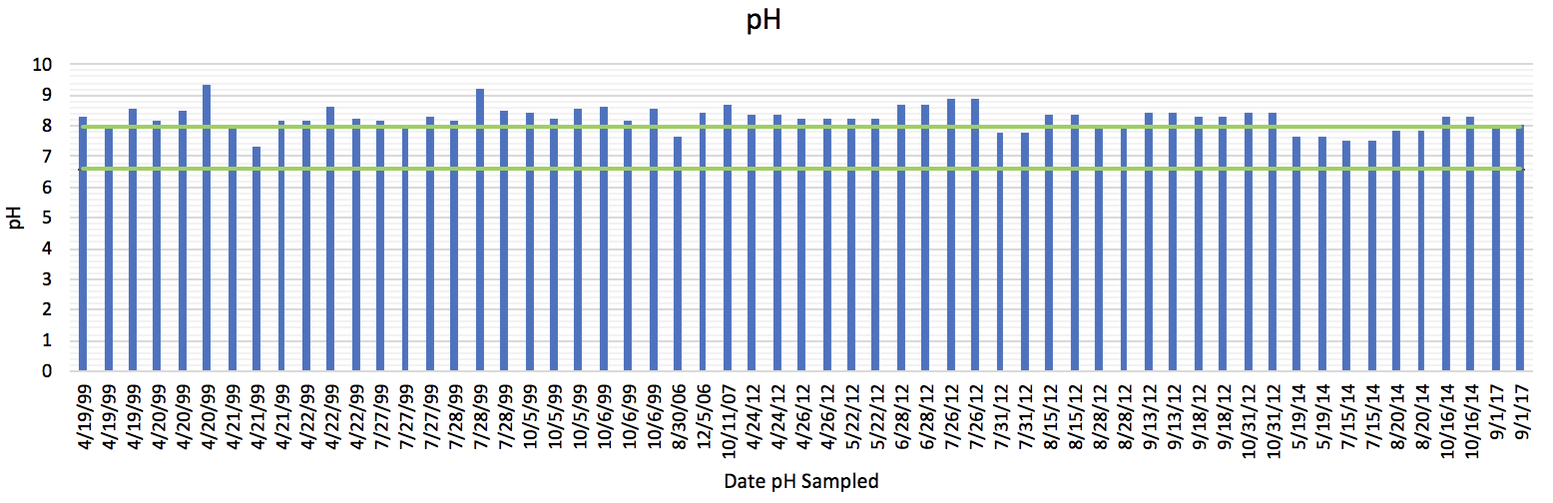
Figure 3: pH values collected from 1999 to 2017
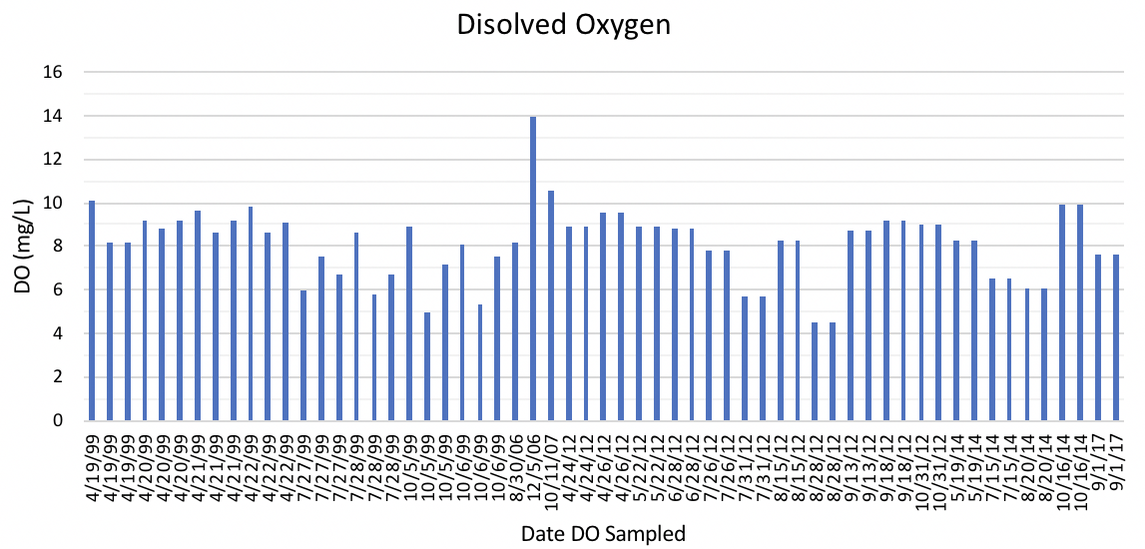
Figure 4: DO values collected from 1999 to 2017
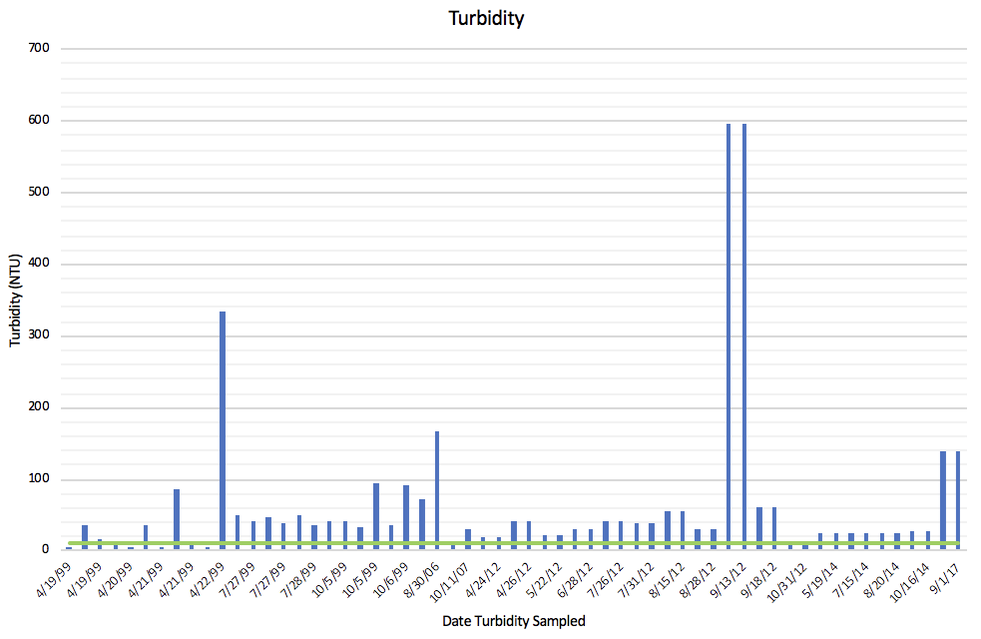
Figure 5: Turbidity values collected from 1999 to 2017
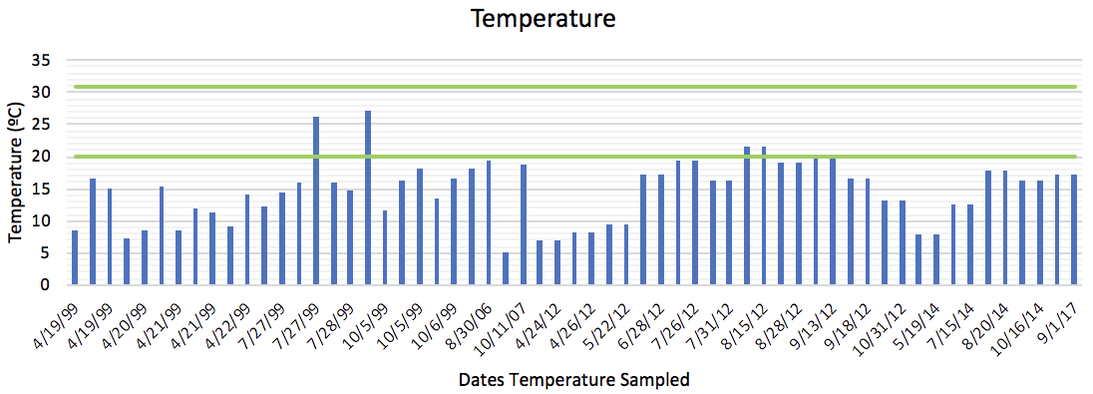
Figure 6: Temperature of the water collected from 1999 to 2017
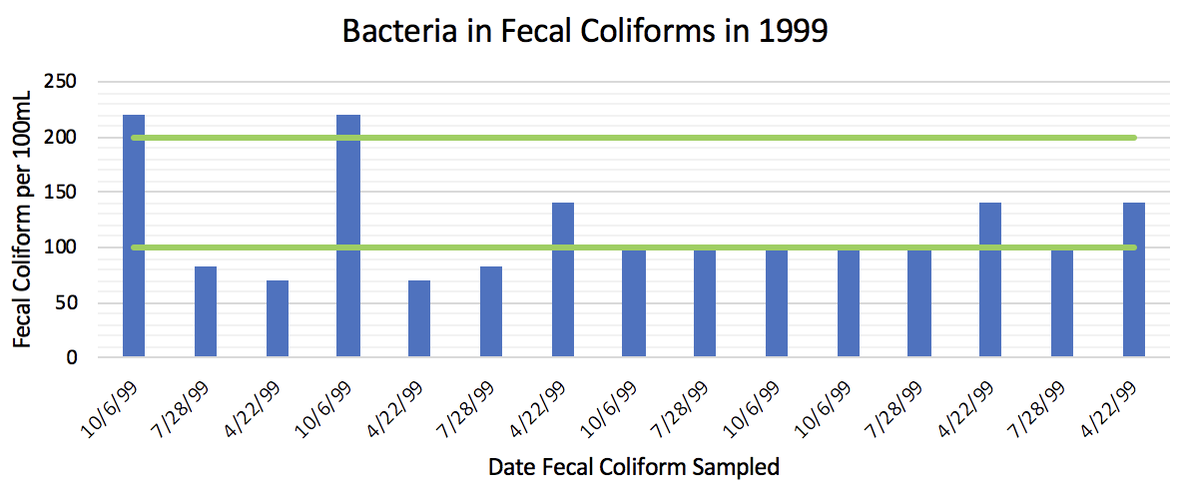
Figure 7: Fecal Coliforms collected in 1999
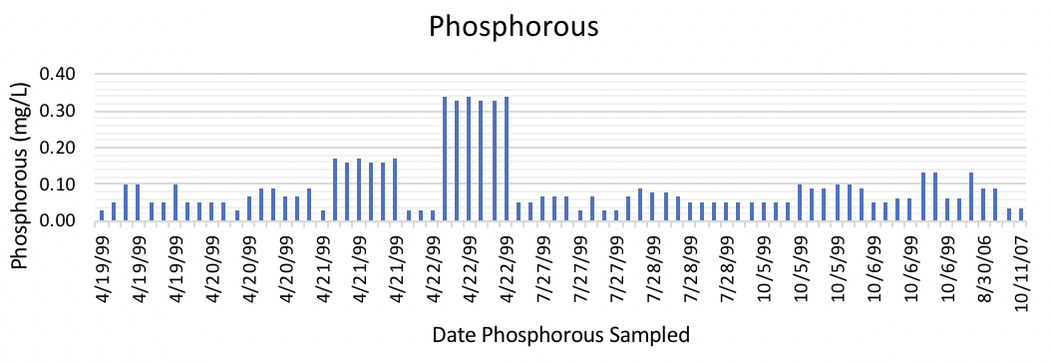
Figure 8: Phosphorous values collected from 1999 to 2007
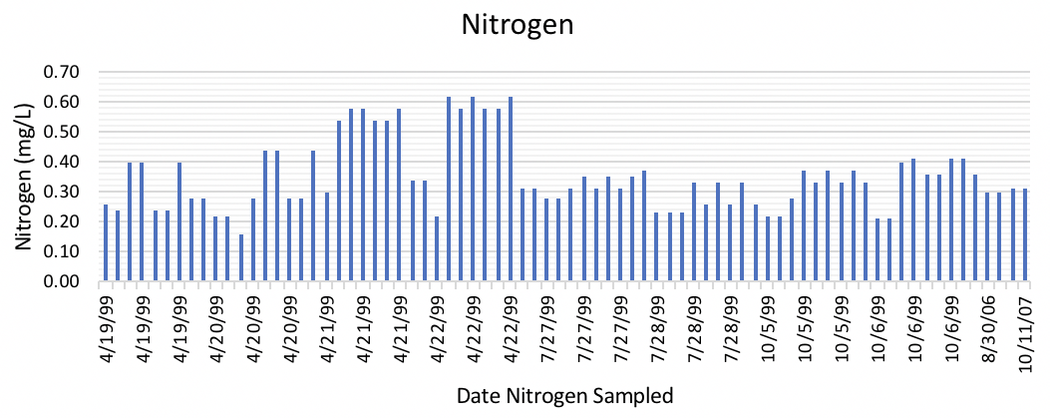 Figure 9: Nitrogen values collected from 1999 to 2007
It is helpful to know how the river is used to pinpoint areas that may contribute to the values in the graphs above. The Rio Chama is primarily used for agriculture; range, pasture and cropland, recreation and mining. The river can be broken down further to different sections and more specifically stating how these areas are used. The chart below (figure 10) includes these segmented areas, the uses and the standards of river parameters they should meet. The Standards for Interstate and Intrastate Surface Waters have designated such standards. Based on these guidelines set there have been exceedance problems within certain streams and therefore multiple of the streams are considered impaired. The table below (figure 11) includes the streams and impairment causes. Although there are a number of different streams along the main stem that have been impaired, there are proposed pollutant load reduction solutions, provided by the Rio Chama Watershed Group, to implement to meet these standards. These solutions are to help with parameters such as turbidity, stream bottom deposits, temperature, dissolved aluminum, fecal coliform and dissolved oxygen. As shown from the graphs (figures 3, 5, 6, and 7) above, the bars exceed the green line limitation. The Rio Chama Watershed Group has also identified issues that have further impacted the river from point sources as well as non- point sources, one of these include wastewater that is entering the river from the treatment plant. For further information on how much the Chama Wastewater Treatment Plant is contributing a further study will need to be conducted. For more information on specific data to implement to meet target loads, the website at the bottom takes you to the Rio Chama Watershed Restoration Action Strategy (WRAS) where specifics are written out in detail.
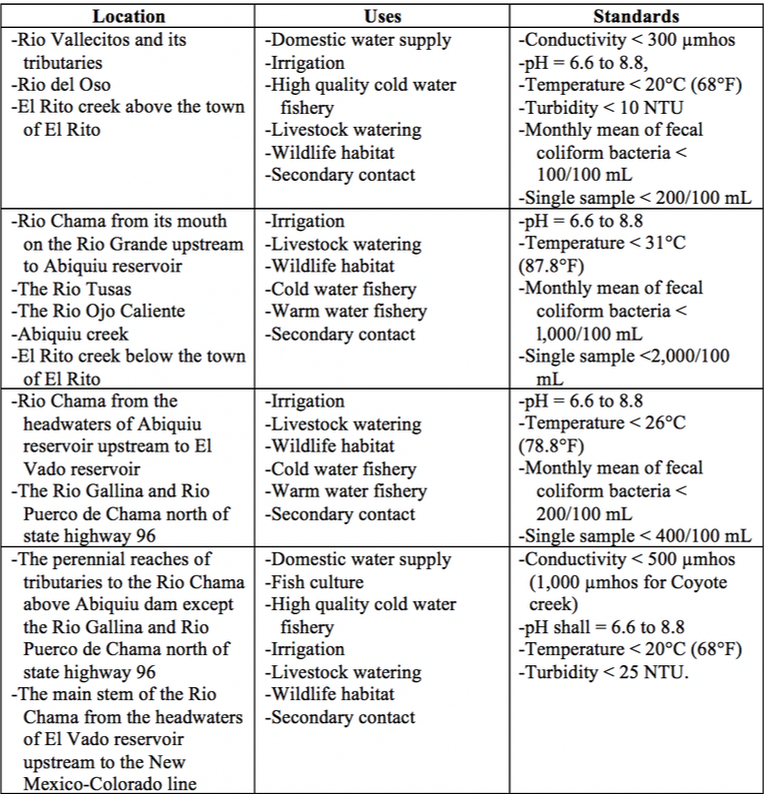
Figure 10: Locations along the Rio Chama, uses and impairments
|
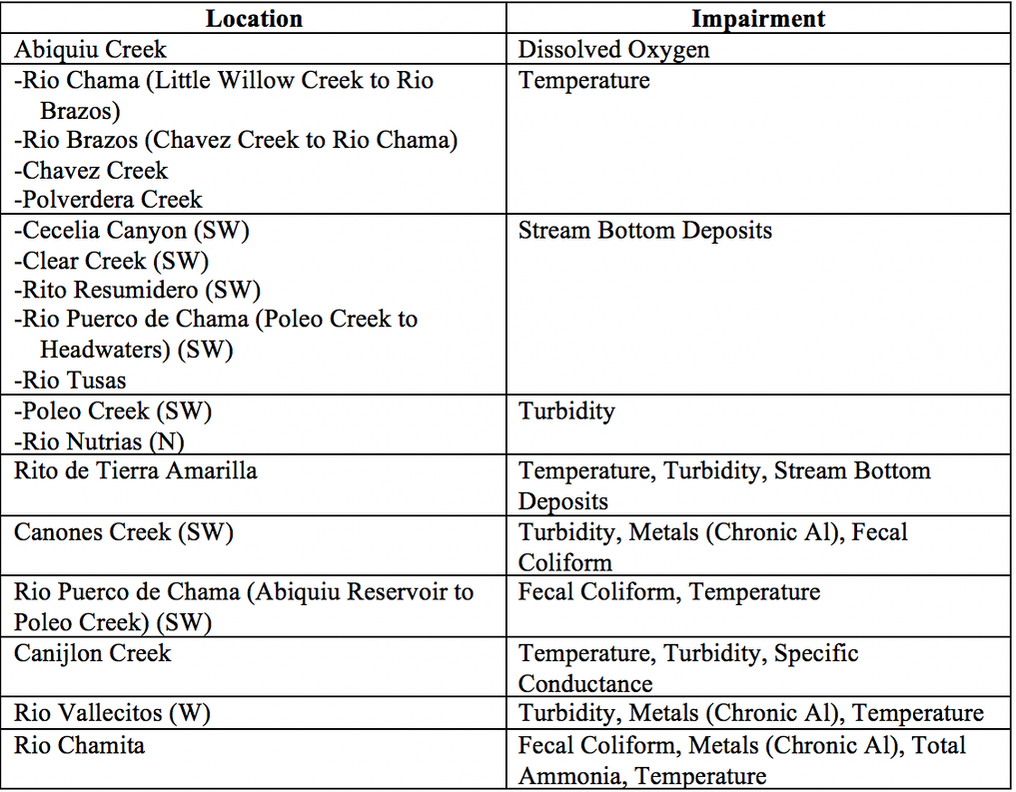
Figure 11: Portions of the Rio Chama impaired
|
Resources
NM Rio Chama Watershed. (2007). Water Quality Assessments For Selected New Mexico Lakes.
Rio Chama Watershed Group. (2005). Rio Chama Watershed Restoration Action Strategy. Retrieved from https://www.env.nm.gov/swqb/wps/WRAS/ChamaWRAS2005.pdf
Surface Water Quality Bureau State of New Mexico CWA §303(d)/§305(b) Integrated List & Report. (n.d.). Retrieved from https://www.env.nm.gov/swqb/303d-305b/
Surface Water Quality Bureau, & NM Rio Chama Watershed,. (2018). State of New Mexico Clean Water Act Section 303(d)/ Section 305(b) Integrated Report. Retrieved from State of New Mexico Clean Water Act Section 303(d)/ Section 305(b) Integrated Report
Surface Water Quality Bureau, & NM Environmental Department,. (2018). State of New Mexico Clean Water Act Section 303(d)/ Section 305(b) Integrated Report. Retrieved from https://www.env.nm.gov/wp-content/uploads/2018/03/Appendix-A-Integrated-List.pdf
Surface Water Quality Bureau, & NM Environmental Department,. (2007). Water Quality Survey Summary For The Chama River And Select Tributaries.
Surface Water Quality Bureau, & NM Environmental Department, (1999). Water Quality Survey Summary for the Lower Rio Chama Watershed. Retrieved from https://www.env.nm.gov/swqb/Surveys/LowerChama1999.pdf