Overview of Downscale Climate Projection
The new set of coordinated climate models, fifth phase of the Coupled Model Intercomparison Project (CMIP-5) organized by working group on Coupled Modeling (WGCM) of World Climate Research Programme’s (WCRP) in 1955 is used in this study to observe the projected trend in temperature, precipitation, SWE and total runoff. This phase of models is based on Global Climate Models (GCM) projections. The data were averaged for 36 GCM models with two different emission scenarios i.e. Representative Concentration Pathways (RCP) 4.5 and RCP 8.5 for Lower Rio Chama. RCP represents the greenhouse gas concentration trajectory adopted by Intergovernmental Panel on Climate Change (IPCC) for fifth assessment report in 2014. RCP 4.5 means the emission will peak at around 2040 and RCP 8.5 means the emissions continue to rise throughout 21st century. The coarse GCM was downscaled to finer spatial resolution using statistical method called as Bias-Correctio and Spatial Disaggregation (BCSD) (USBOR, 2016). The downscaled monthly data for precipitation, surface air temperature (maximum and minimum), SWE, total runoff is available from Downscaled Climate and Hydrology Projections (DCHP) (Maurer et al., 2014).
The summary of climate projections (temperature, precipitation, SWE, total runoff) are shown in figures. The data represent the projections for Rio Chama watershed for Abiquiu dam.
The summary of climate projections (temperature, precipitation, SWE, total runoff) are shown in figures. The data represent the projections for Rio Chama watershed for Abiquiu dam.
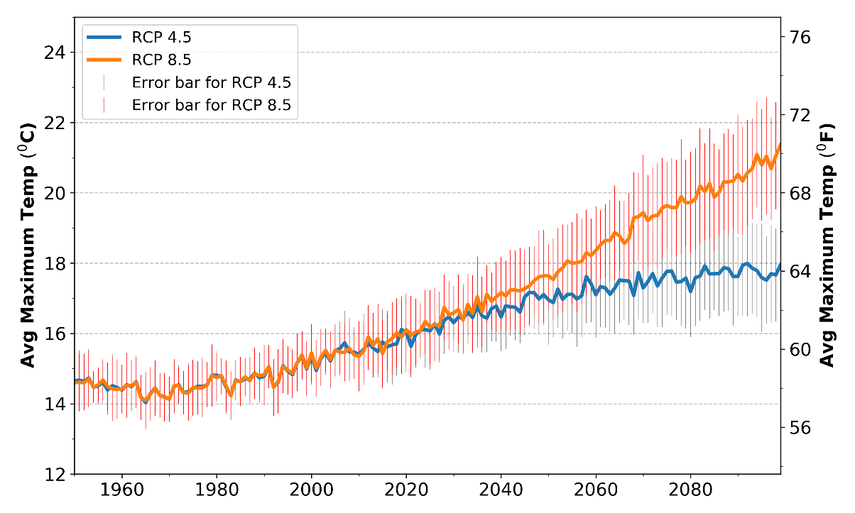
Figure 1: Average Maximum Temperature
|
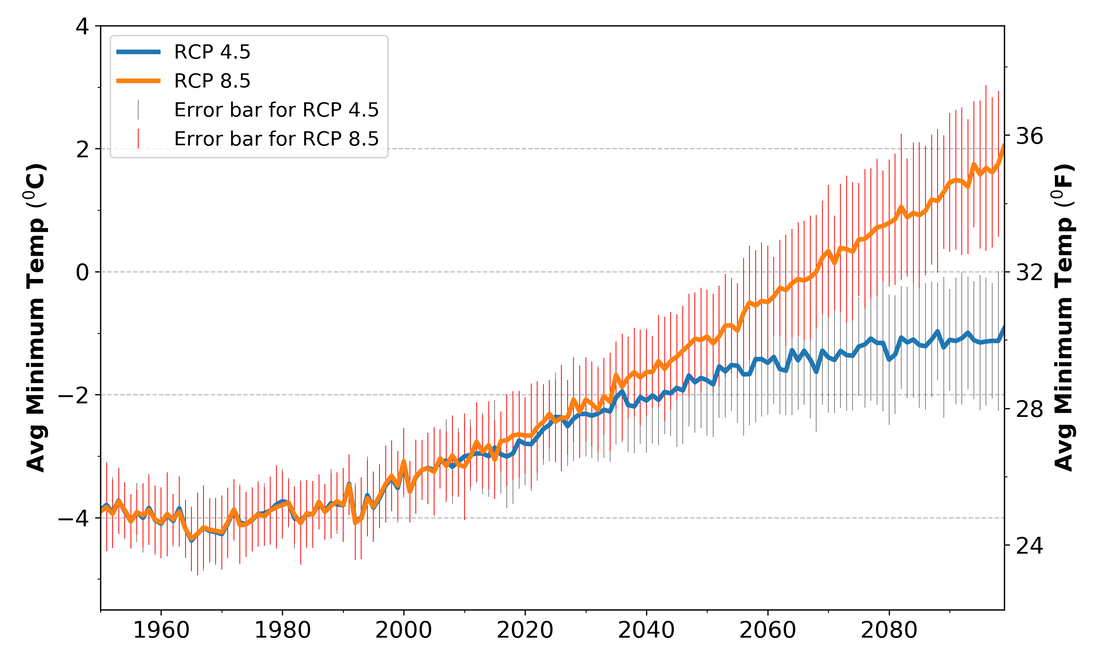
Figure 2: Average Minimum Temperature
|
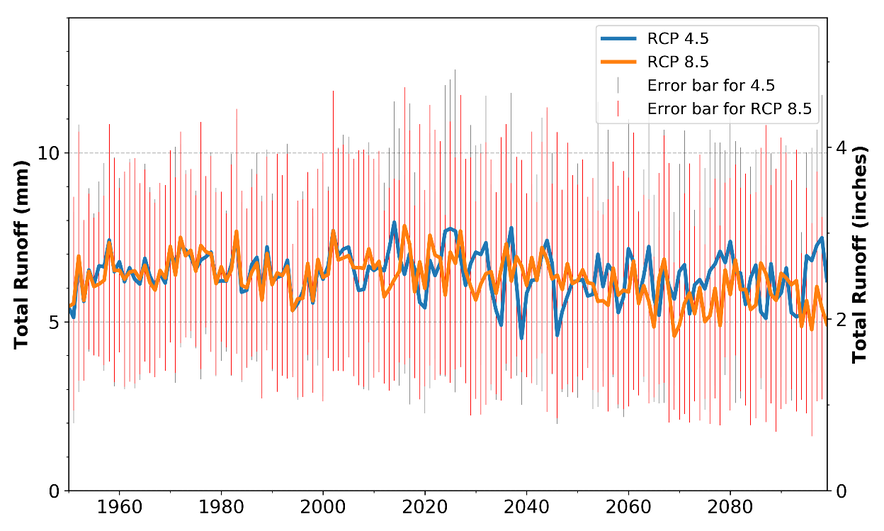
Figure 3:. Total Runoff
|
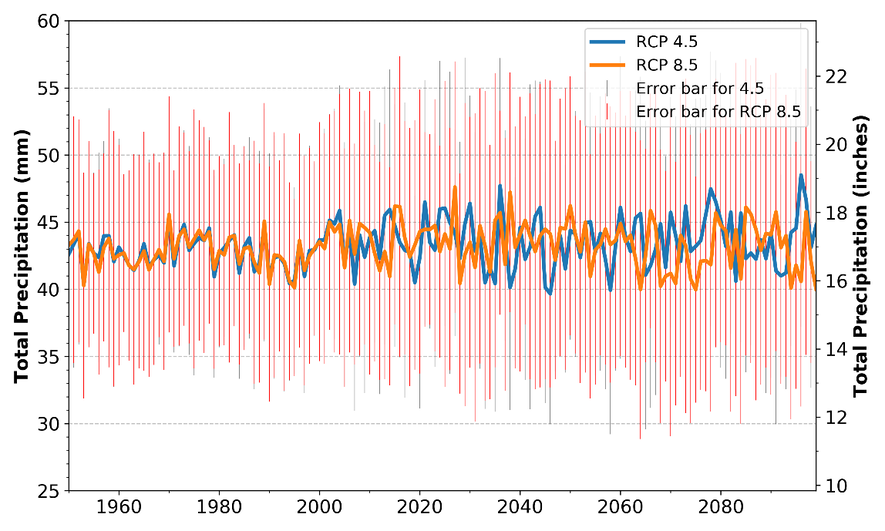
Figure 4: Total Precipitation
|
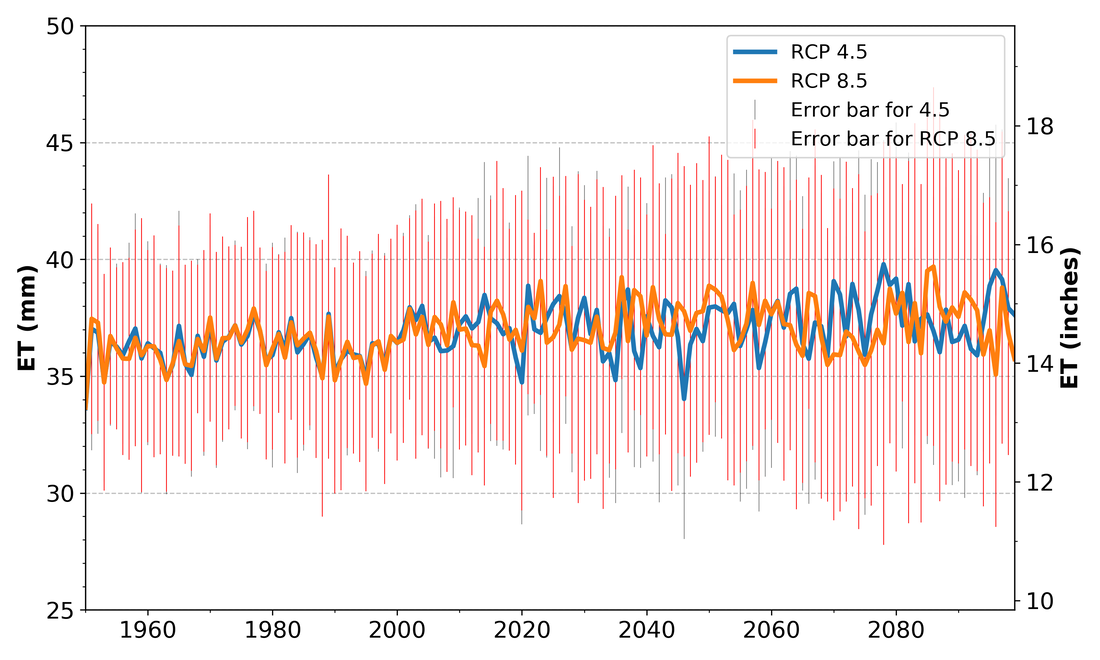
Figure 5: Evapotraspiration
|
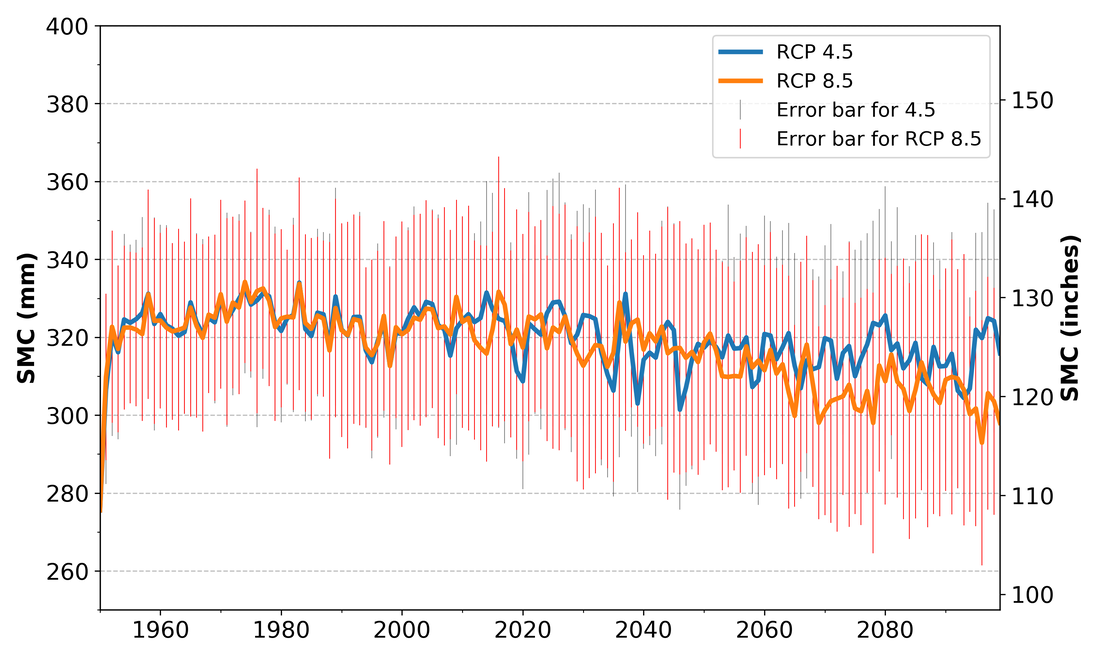
Figure 6: Soil Moisture Content
|
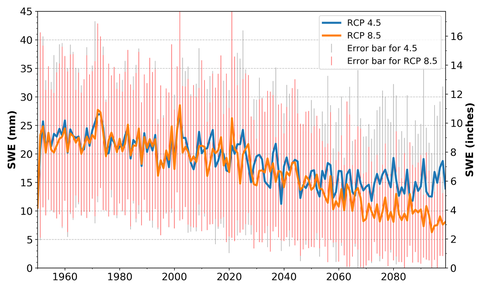
Figure 7: Snow Water Equivalent
Discussion
The change in climate are observed through the change in temperature, pattern of precipitation snowfall and so on. The impact of climate change in water resources are decrease in the amount of instream flow, decrease in the rate of infiltration due to less rainfall or drought declining ground water level, flooding due to heavy uncertain rainfall, melting in snow and decreasing the amount of snow cover.
From the projected climate data, it is seen that the temperature will increase in future with unpredictable pattern of precipitation and total runoff and decrease in SWE. It also shows that amount of moisture content in soil will also decrease whereas the rate of evapotranspiration will increase. All these characteristics indicate the intense drought in future.
Increase in temperature means the increase in demand of water for different purposes. The demand of water also depends on the population and the projected population shows the increase in population in future. The demand of water by population also depends on the economic condition. Decrease in soil moisture content will affect in the crop production. These changes led for finding the resilience solution to overcome the possible impacts of climate change on the water resources in future.
References
- Maurer, E. P., Brekke, L., Pruitt, T., Thrasher, B., Long, J., Duffy, P., … Arnold, J. (2014). An Enhanced Archive Facilitating Climate Impacts and Adaptation Analysis. Bulletin of the American Meteorological Society, 95(7), 1011–1019. https://doi.org/10.1175/BAMS-D-13-00126.1
- USBOR. (2016). West-Wide Climate Risk Assessments: Hydroclimate Projections (Technical Memorandum) (p. 154). Denver, Colorado: U.S. Department of the Interior Bureau of Reclamation Technical Service Center.