Flow Exceedance
The flow exceedance curve represents the percent of time a flow/discharge it equals to or has exceeded. A flow exceedance curve basically symbolizes the capability of the basin to provide flows with different types of discharge. The flow exceedance curve or in other words the flow duration curve has a vast variety of applications such as setting river flow objectives, scenario evaluation, and evaluation of sediment or contaminants. The graph and exceedance curve below are of the flows of the Rio Chama.
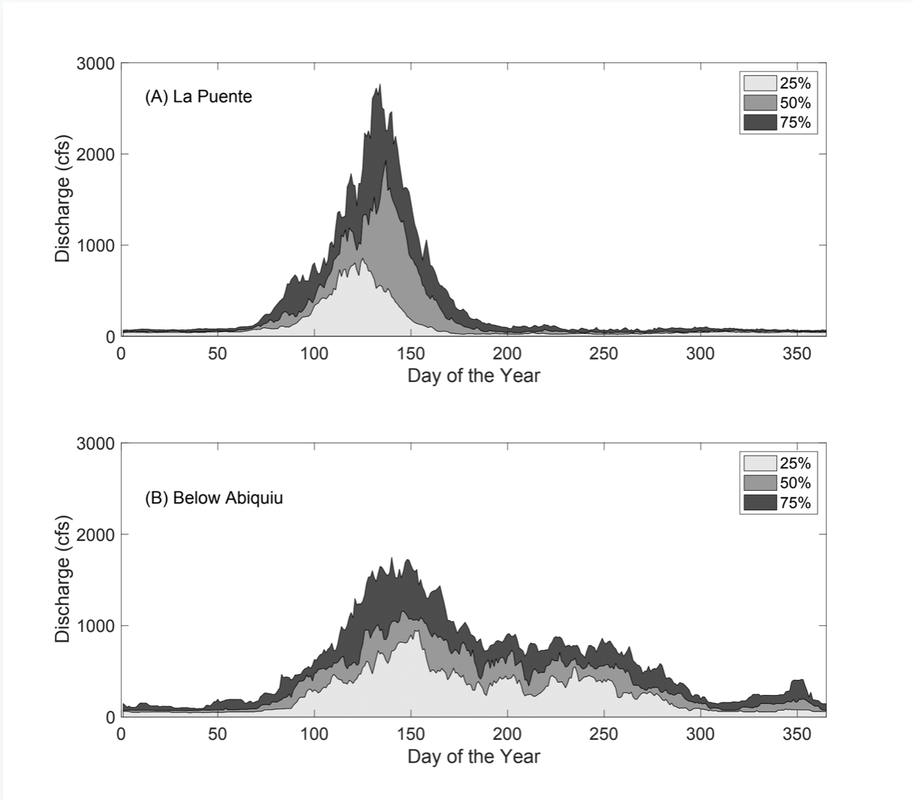
Graphs created by Mark Charles Stone using Matlab
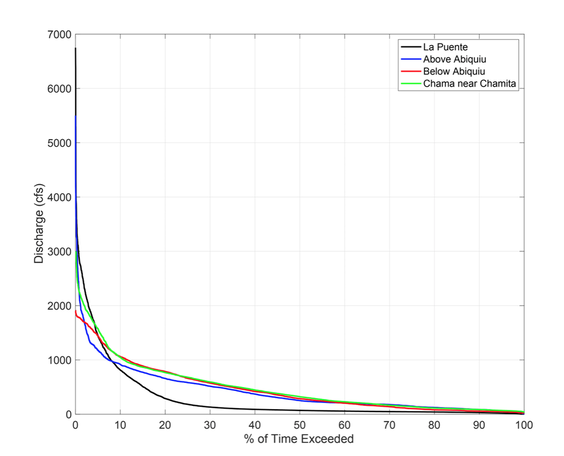
Flow exceedance curve of the Rio Chama created by Mark Charles Stone using Matlab
Management and Condition
There have been several alternative flows modeled for the entire Rio Chama. In the present, even though the Rio Chama has a capacity of 6000 cfs below Abiquiu, this is reduced to 1800 cfs by the U.S. Army Corps of Engineers to protect diversions and flood protection infrastructure. In Morrison and Stone (2015) several flows were studied in order to have more natural conditions. A discharge of 2500 cfs, every two years for five consecutive days, is necessary from El Vado in order to transport sediment downstream. Riparian vegetation needs higher discharges due to the need of flooding. The lack of flooding in the Rio Chama is affecting the cottonwood trees and is impeding them from reproducing. In order to have very healthy riparian vegetation a flow of 4500 cfs would be needed every 5 years for five days but decreased by 5 percent each day between April and July, as studied in Morrison and Stone (2015). This discharge would inundate the floodplain and encourage riparian vegetation to reproduce. The downside to these discharges is that these flows are not suitable for irrigation and to protect the infrastructure that is in place to protect people from flooding. The Rio Chama is narrowing as time goes by, and the reason is that the minimum discharge that is needed in order to flush sediment downstream is not being met. Sediment is accumulating, and the channel is changing given that there is not a need for a bigger channel if the maximum discharge that it sees is 1800 cfs. Farmers and people living in the area are fighting in order to make the maximum discharge even smaller, without realizing that someday the river will not provide enough water to farm.
From 1961 to 1962, the peak discharge below Abiquiu was 1870 cfs, which was then lowered by the construction of the dam, which shows why the peak discharge below Abiquiu from 1963 to 1964 was 1020 cfs. The peak discharge from 2017 to 2018 was 1130 cfs, which shows that the discharge has been significantly dropped since the building of the dam until now. These discharges are not enough to keep the channel in a good condition given that sediment will accumulate, and the floodplain will not flood, which will affect the condition of the riparian vegetation. The U.S. Army Corps of Engineers runs 1800 cfs down the river at certain times to keep the river from shrinking, but this discharge is not enough. The problem is that there are man-made diversions which will not be able to sustain flows higher than 1800 cfs.
From 1961 to 1962, the peak discharge below Abiquiu was 1870 cfs, which was then lowered by the construction of the dam, which shows why the peak discharge below Abiquiu from 1963 to 1964 was 1020 cfs. The peak discharge from 2017 to 2018 was 1130 cfs, which shows that the discharge has been significantly dropped since the building of the dam until now. These discharges are not enough to keep the channel in a good condition given that sediment will accumulate, and the floodplain will not flood, which will affect the condition of the riparian vegetation. The U.S. Army Corps of Engineers runs 1800 cfs down the river at certain times to keep the river from shrinking, but this discharge is not enough. The problem is that there are man-made diversions which will not be able to sustain flows higher than 1800 cfs.