Current challenges
For our study reach, we have considered the recommended environmental flows (e-flows) for the reach between the El Vado dam and Abiquiu dam right above our study area as a reference for alternative flows. Current scenario for our study reach and the recommended e-flows can be found here.
Inundation pattern due to different flows
The hydraulic connectivity between the floodplain and main channel is necessary for establishment of healthy riparian habitats. Generally, connectivity is achieved through over banking due to high flows, channel reconstructing (back water channel, bank line grading) and so on.
The inundation pattern due to different flows were analysed using two-dimensional hydrodynamic model, Hydrologic Engineering Center, River Analysis System (HEC-RAS 5.0.6) . The model was simulated for steady state condition for four different flows which were considered as low, medium, high and extreme flows. Slide shows above represents different inundation pattern overlapping on riparian vegetation with Acequia structures. The model was simulated to observe if the riparian zone will be inundated during different flows.
First figure of the slide shows the distribution of riparian vegetation the along the reach of Rio Chama for our study area. Most of the riparian zone is covered by exotic species like Russian Olive and smaller patched are covered by native species like cottonwood and coyote willow. The high flow here is discussed specially for the recruitment of cottonwood and flushing of sediments from the river bed.
In case of low flow, the riparian vegetation is not inundated. When the flow was increased to medium flow, there is small increase in inundation along riparian zone. But that flow has started to inundate Acequia structures and agricultural land. The inundation extent has increased for higher and extreme flows, which is favorable for riparian vegetation but not from the prospective of Acequia structure and cultural farms. There are some recommendations listed below this page that includes the general ideas for the protection of Acequia structures and prevention measures from the flooding of farms during high flows.
The inundation pattern for different flows conveys that higher flow is required for flooding floodplains. This indicates the amount of flow that is released down the dam is not enough for riparian vegetation.
Environmental flow analysis for ecological restoration
The Indicators of Hydrologic Alterations (IHA) tool developed by The Nature Conservancy (TNC) is commonly used to determine the environmental flows alteration due to influence of construction of dam in the prospective of habitat restoration. This tool is useful in comparing the pre development and post development scenarios .i.e. pre and post hydrologic condition because of dam construction. We used this tool to understand the magnitude, frequency and duration of low flow and high flow pulses.
For our study area, daily stream flow data measured at USGS gaging station (08287000) below Abiquiu dam was used. The USGS gaging station below Abiquiu dam started to collect data from 1961 and dam was started to operate in 1963. Because of that, there aren't enough data to analyze the effect of construction of dam. However, the effect of dam can be observed through the change in channel alignment, channel width, riparian vegetation and fish habitats because of limitation in releasing maximum flow below the dam.
The construction of dam has altered the high and low flows and changed the timing of peak flows. These changes can affect the recruitment of native species and encourages the establishment of non-native species like Salt Cedar in riparian corridor. Also, the change in timing of peak flows altered the suitable condition required for spawning of fish habitats.
Small flow pulses
|
Figures 1, 2 and 3 below represents the small flood event, frequency and duration of occurrence. The smaller flood events seem to occur few years and the frequency of occurrence is also low. The smaller flood event is significantly dropped or there are no small flood events in most of the years. Also, the duration of the small flood is also less. Some of the smaller flood events exits for more than 30 days in a year. This means this reach does not receive high enough flow for small flood events.
|
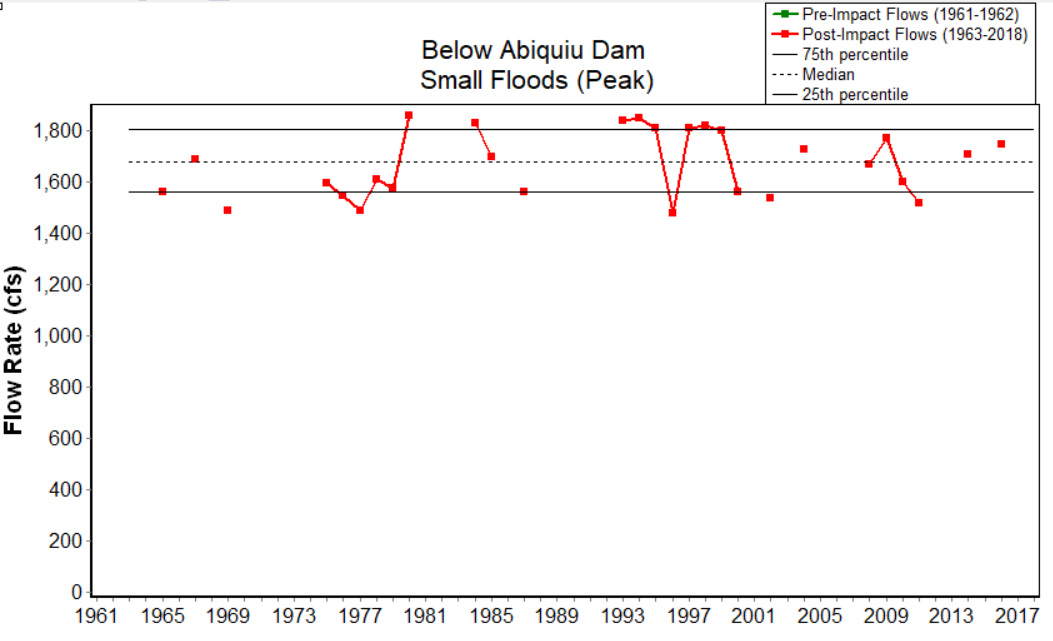
Figure 1: Small flood pulses (Peak)
|
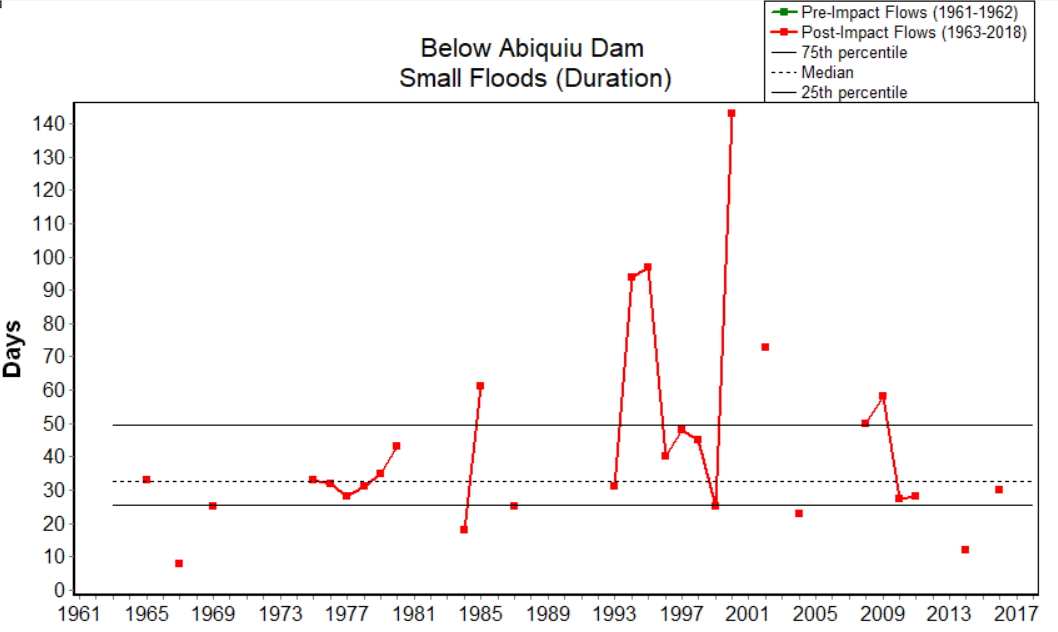
Figure 2: Small Flood duration
|
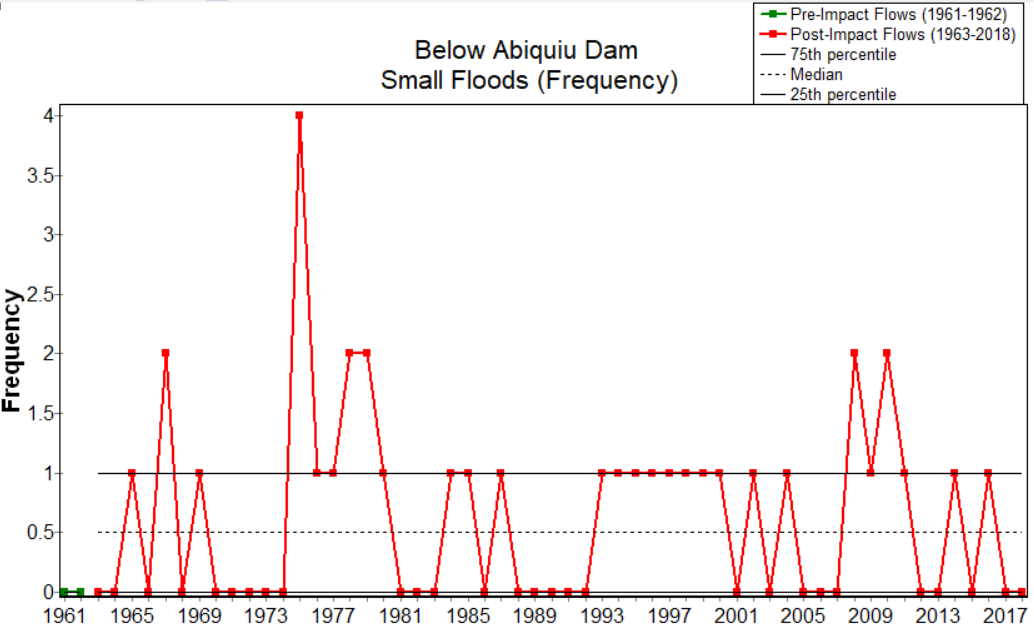
Figure 3: Small Flood frequency
|
High Flow pulses
High flow pulses magnitude, frequency, duration and timing have greater influence in the recruitment and maintenance of riparian vegetation. The less high flow pulses can cause aggregation of sediments in river bed which will cause in narrowing of the channel. If the sediments from sand bars are not flushed out frequently then, it will have an effect on the spawning of brown trout. There is no doubt that timing of high pulses has also shifted due to drought in New Mexico and this information can be found over here.
|
Figures 4, 5 and 6 represent the high flow pulses magnitude, frequency and duration of occurrence respectively. The high flow pulses are below 1200 cfs .The magnitude of high flow pulses is about 900 cfs only. Figure 5 shows that there is fluctuation in frequency of occurrence of those events. The median frequency is only 5 which means 5 times occurrence of high flow pulses. The median of high flow pulses is about 4 days only in a year. The graph also shows that duration for high flow in 2013 was highest which existed for around 30 days. The magnitude, frequency and duration represented by the historical data shows there wasn't enough flow to support the riparian habitats.
|
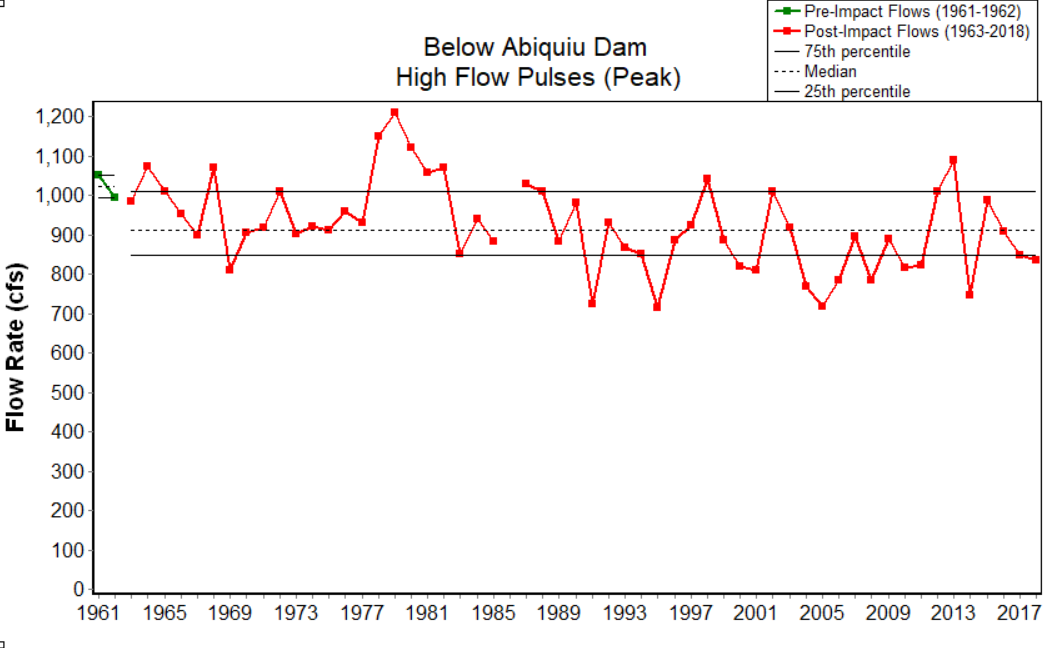
Figure 4: High Flow Pulses (Peak)
|
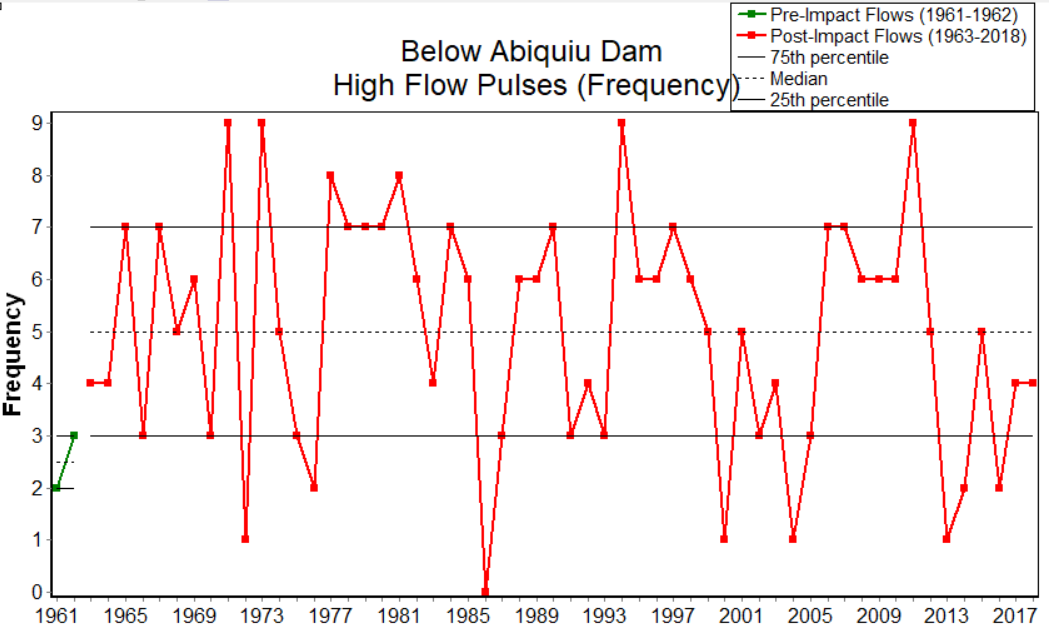
Figure 5: High flow pulses frequency
|
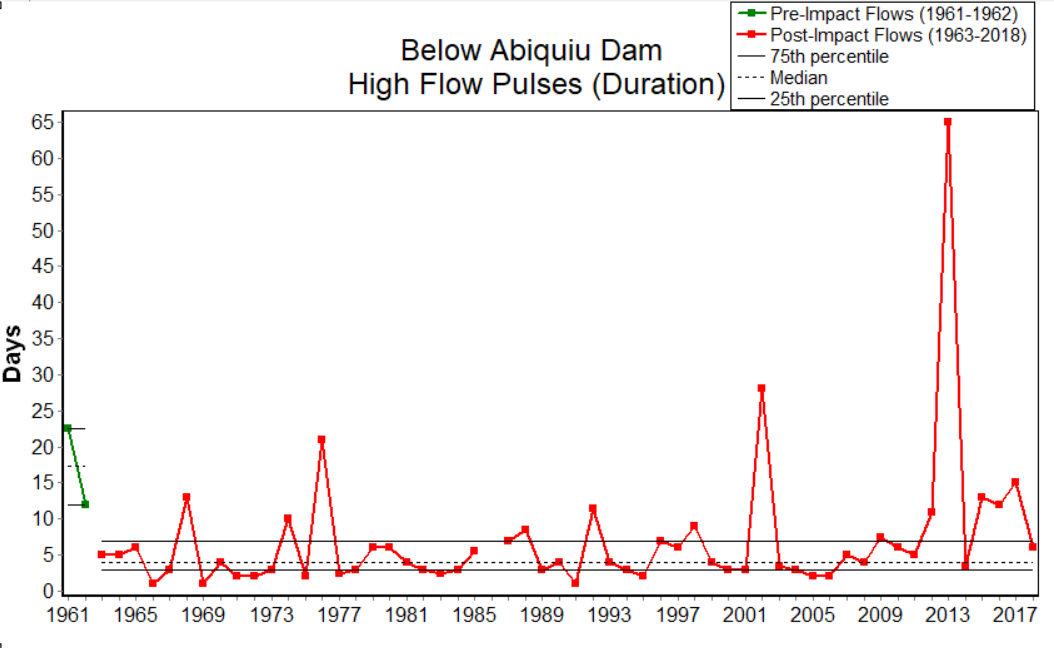
Figure 6: High flow pulses duration
|
Recommendations
Alternative flows:
When the high flow pulses rate and frequency are increased, then it will have severe effect on the Acequia diversion structures. In order to protect the Acequias we have suggested several options which can be found in Ecological restoration, structure consolidation topic.
- Increasing the High and low flow pulses magnitude, duration and frequency
- Overbank flooding
- Backwater channel
- Storing water in Cochiti dam during release of high flow pulses
- Bankline grading, bankline terrace, high flow channel
When the high flow pulses rate and frequency are increased, then it will have severe effect on the Acequia diversion structures. In order to protect the Acequias we have suggested several options which can be found in Ecological restoration, structure consolidation topic.
- Riprap to protect bed of intake structure of Acequias and downstream of diversions from erosion due to high flow
- Stabilizing the Acequias through regular repair and maintenance or lining with concrete
- Levees construction to prevent flooding of agricultural land